
News

Southeast Ohio Has A High Rate Of Fatal Crashes, But The Reasons Why Remain Elusive
By: David Forster
Posted on:
ATHENS, Ohio (WOUB) — Southeast Ohio has a high number of fatal traffic crashes relative to the state overall, and this year is on track to be one of the worst in recent years.
The southeast region has had 11 more fatal crashes than at this time last year.
That may not sound like a lot for such a large geographic area. But the region ended last year with 62 fatal crashes, so 11 more is already an increase of nearly 18 percent with just under three months still to go.
It’s difficult to say why southeast Ohio has such a high rate of fatal crashes. Even knowing the cause of the crashes doesn’t explain why there are so many more of them here relative to the state as a whole.
The Ohio State Highway Patrol, which collects and tracks all this crash data, does not have an explanation.
WOUB reached out to sheriffs throughout southeast Ohio asking if they could at least offer some educated guesses as to the reasons why, but did not receive any responses by the time this story was published.
The rate of fatal crashes in the region is even higher, by significant margins, than the rates for Franklin and Cuyahoga counties, the two most populous counties in the state and the two with the highest number of average daily miles driven.
For this story, WOUB analyzed traffic data collected by the Ohio State Highway Patrol and the Ohio Department of Transportation.
For southeast Ohio, data was used from OSHP’s District 9, which includes the counties of Athens, Gallia, Hocking, Jackson, Lawrence, Meigs, Pike, Ross, Scioto and Vinton.
To make meaningful comparisons, the data was processed in two ways.
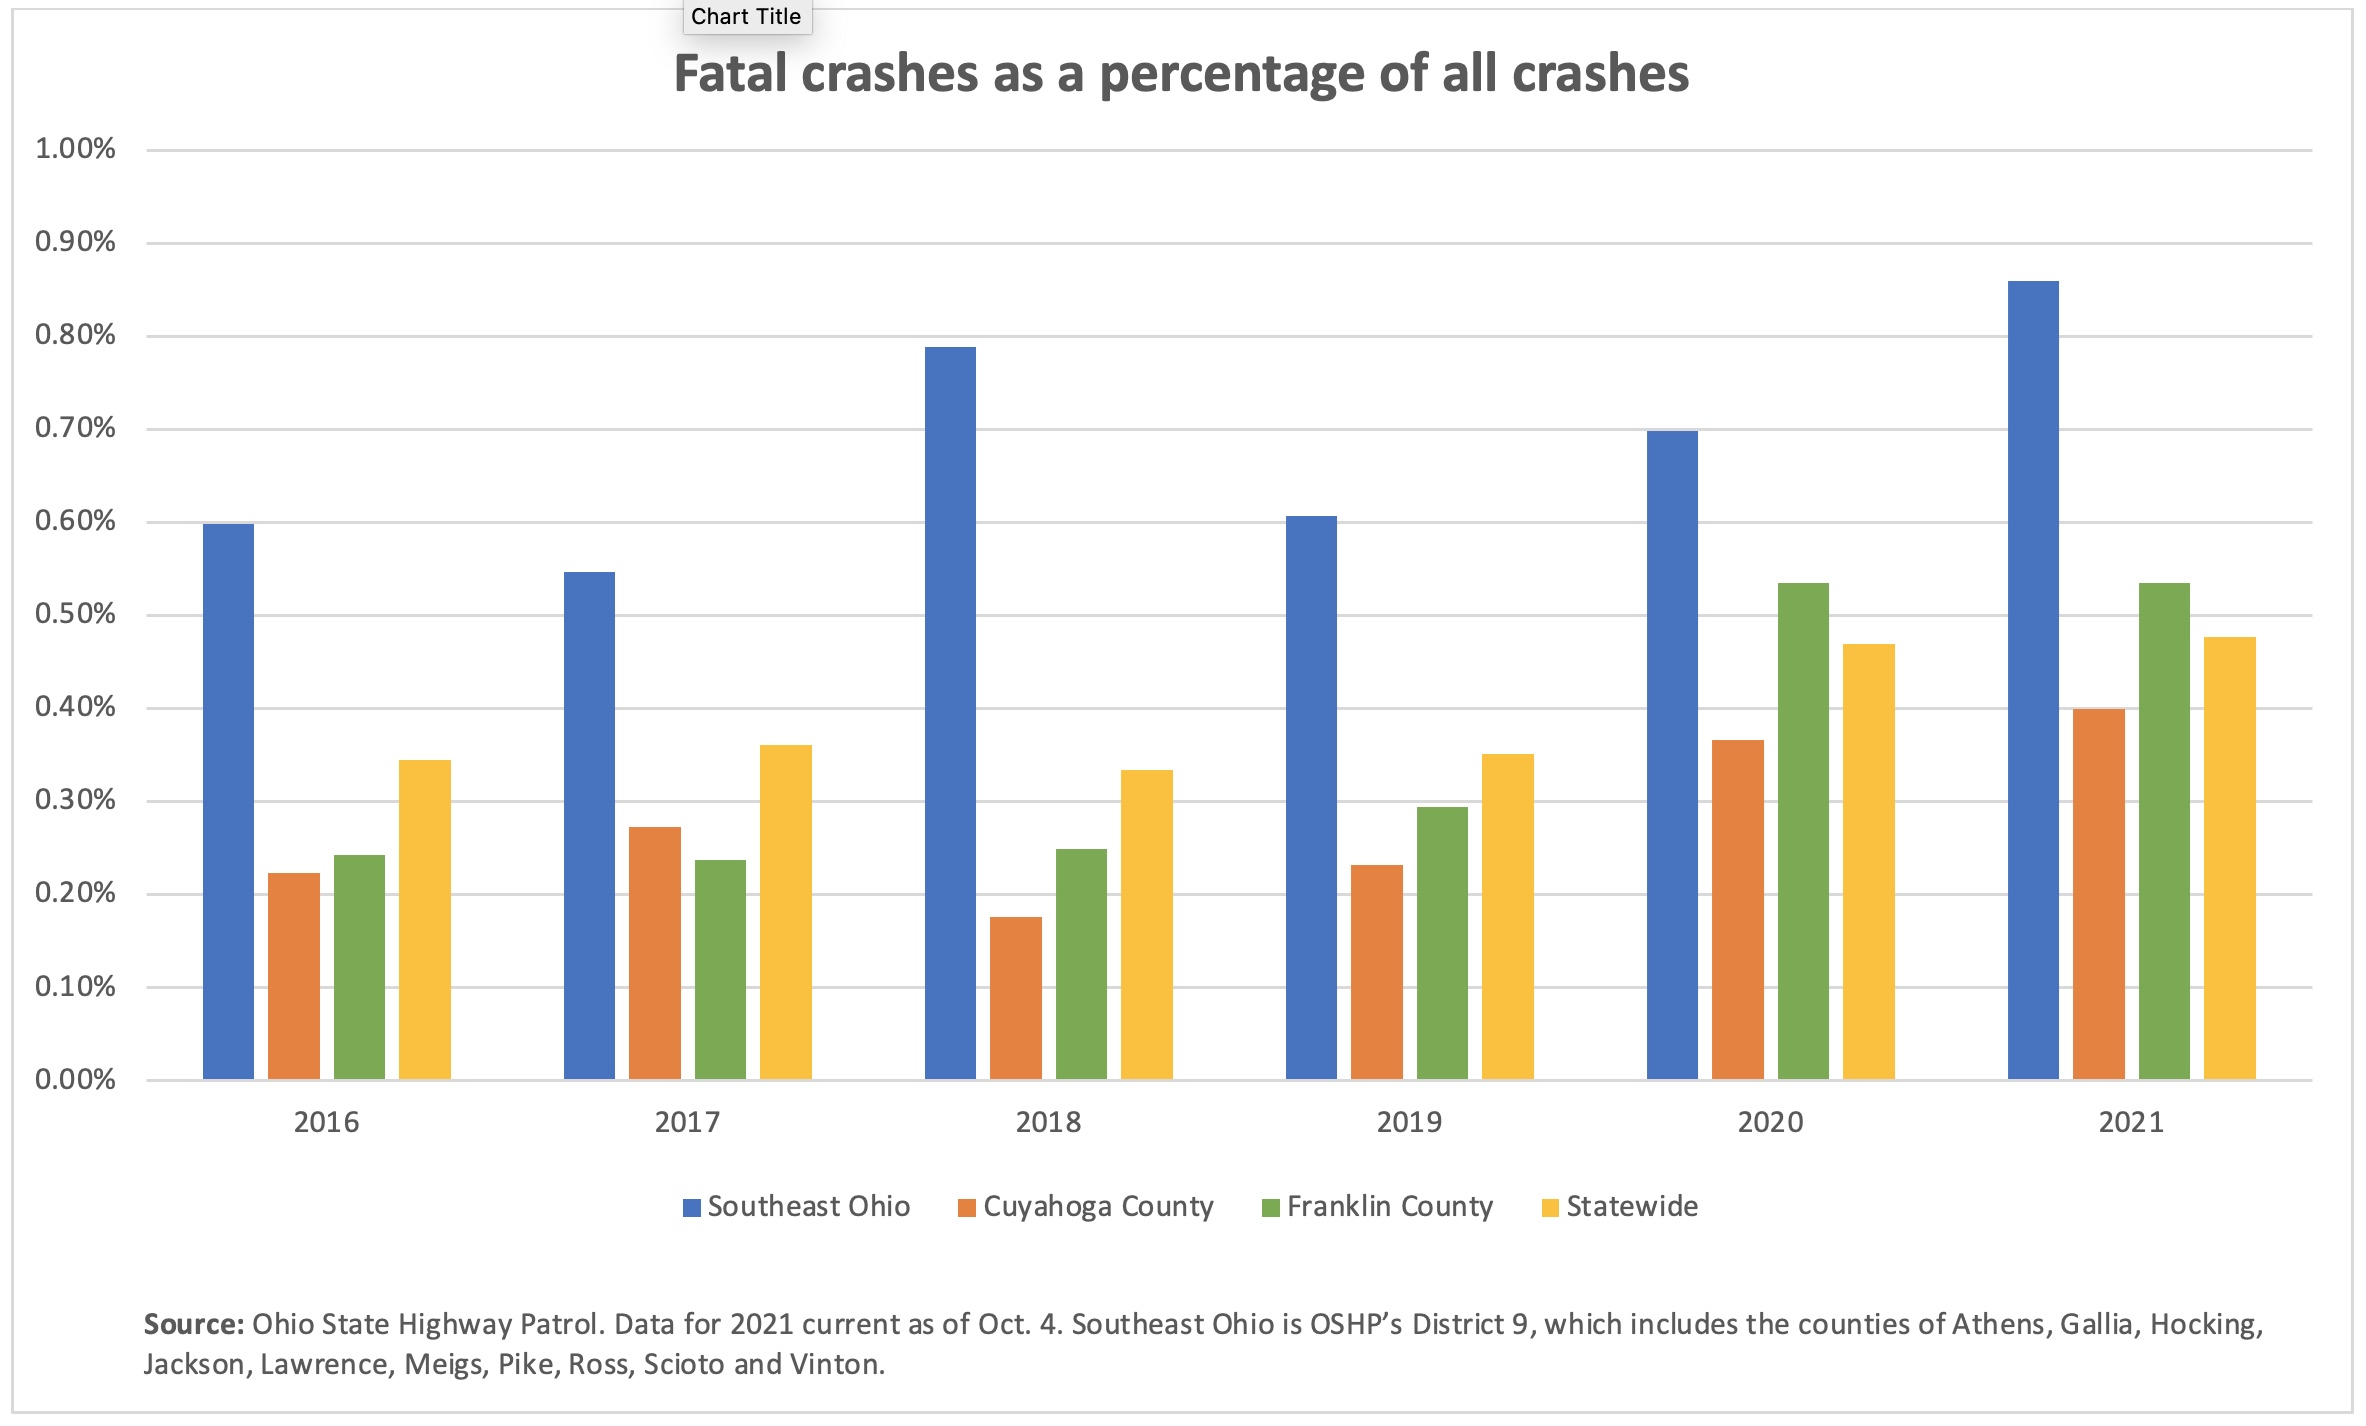
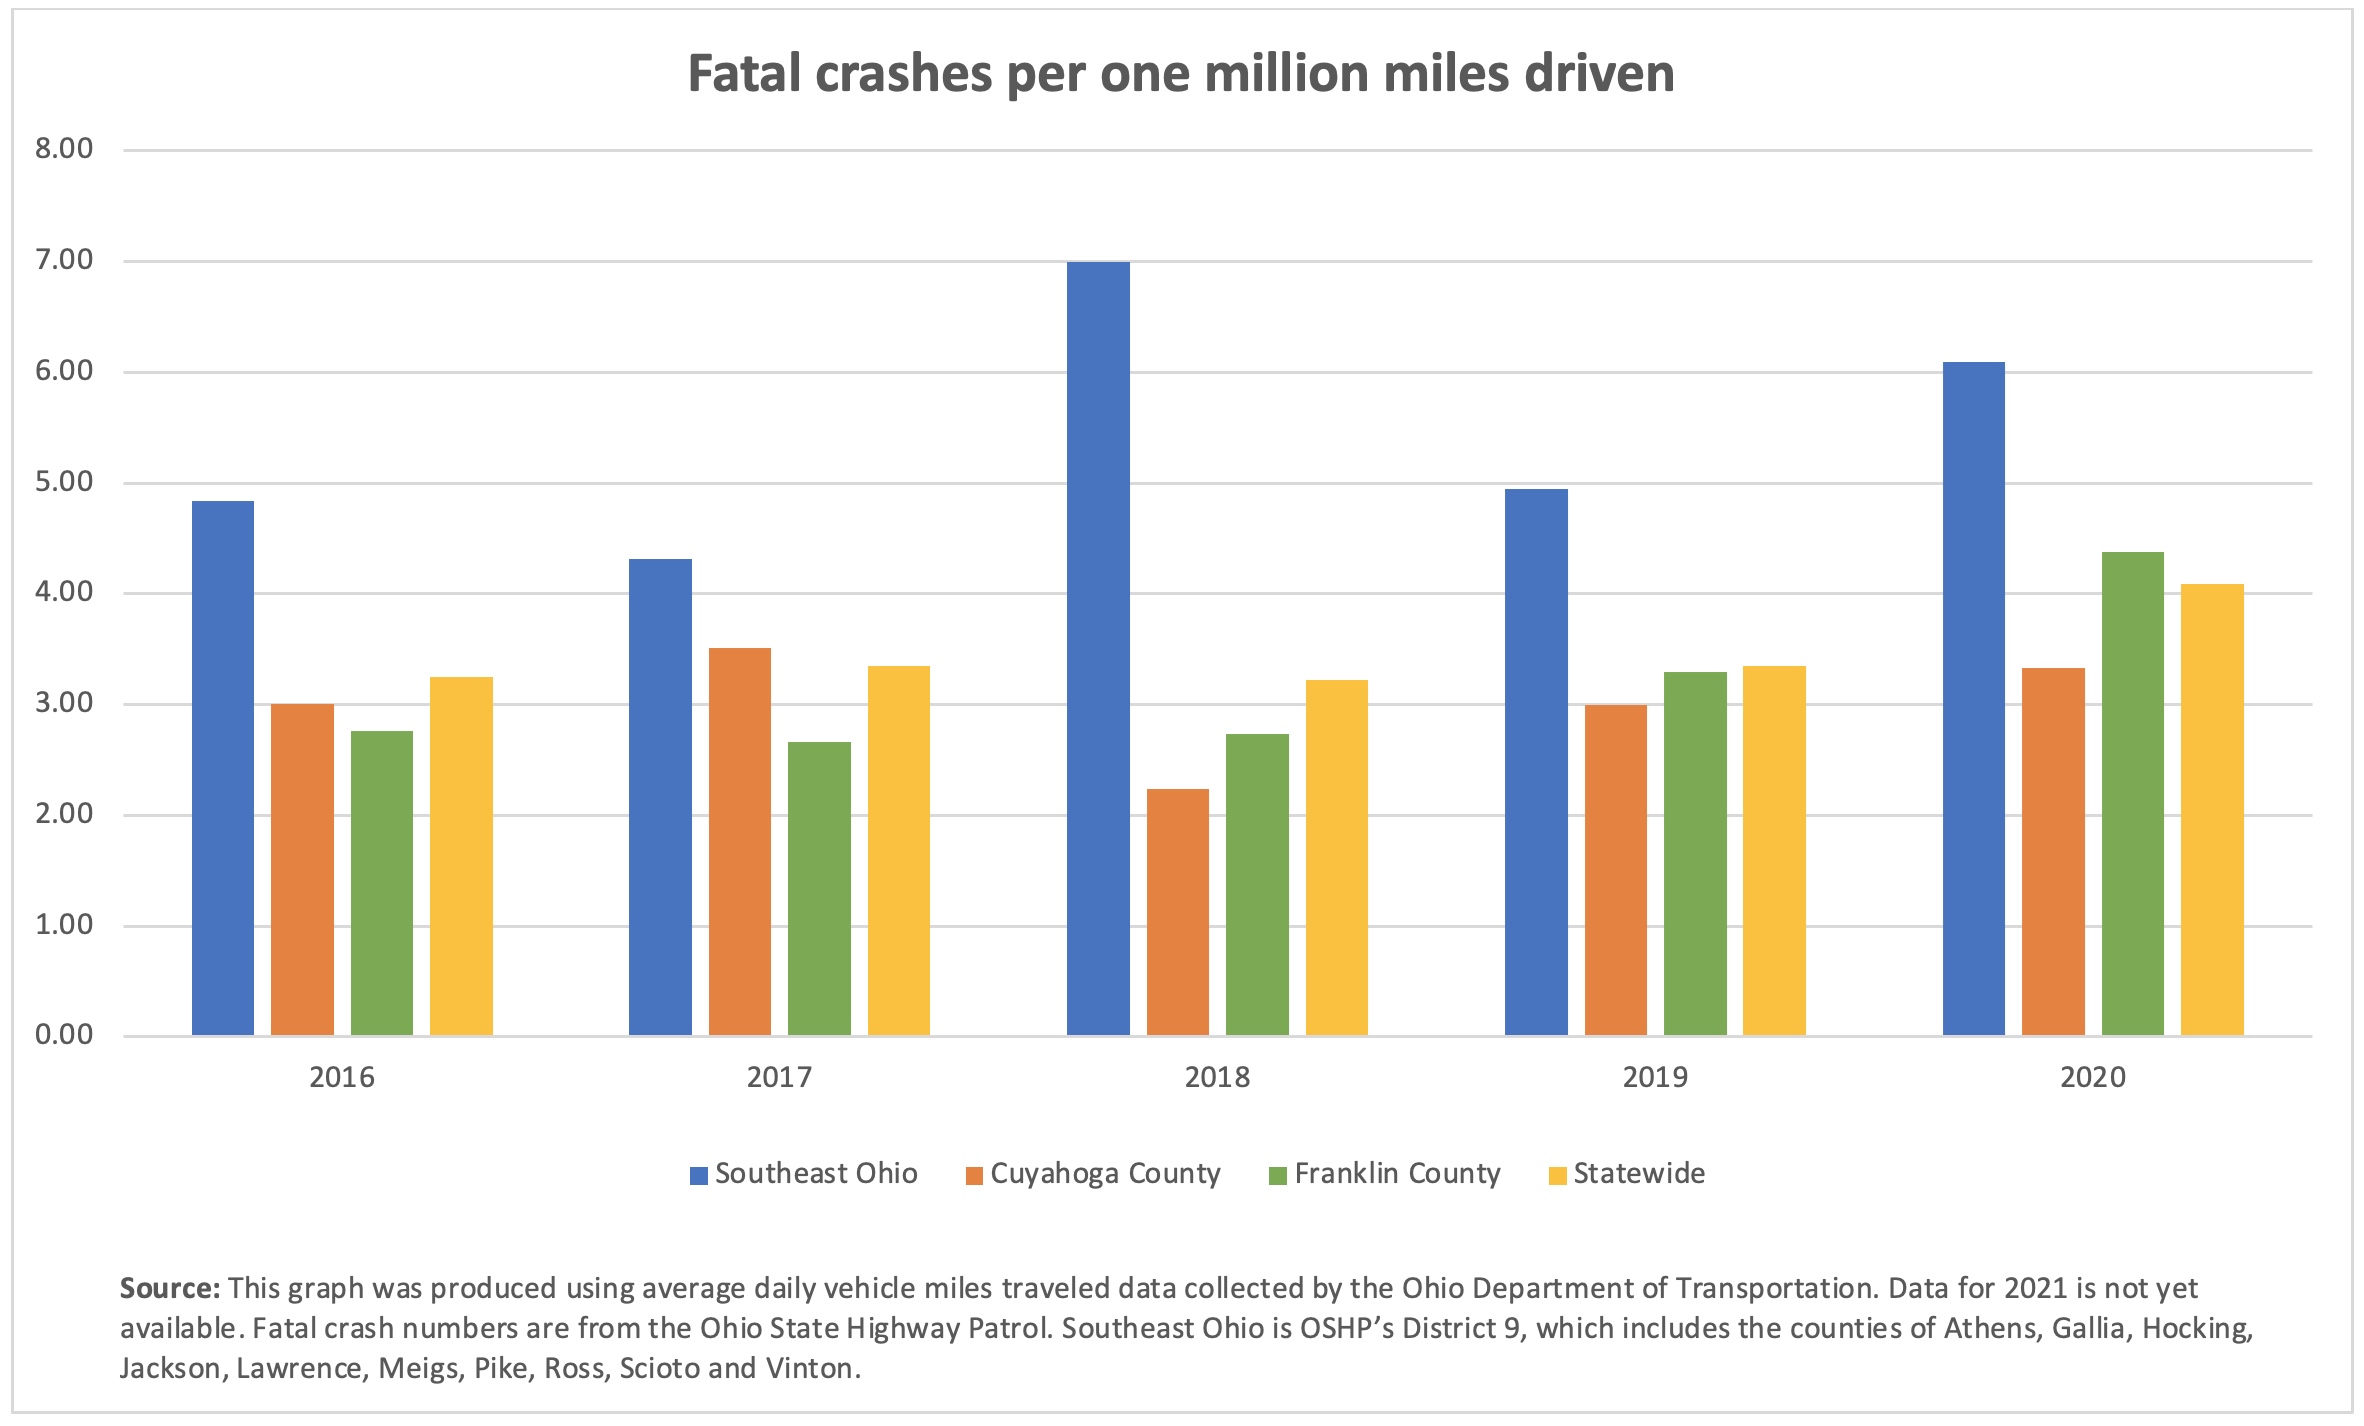
One was to look at the number of fatal crashes as a percentage of all crashes. The second was to look at the number of fatal crashes compared with the average number of daily miles driven, an analysis recommended by statisticians at OSHP.
Two of the graphs included in this story illustrate these comparisons.
The number of fatal crashes as a percentage of all crashes is significantly higher for southeast Ohio than the statewide number and the numbers for Cuyahoga and Franklin counties. This is true year after year going back to at least 2016, the earliest date for which data from OSHP was readily available.
The number of fatal crashes per 1 million daily miles driven is significantly higher for southeast Ohio than the statewide number and the numbers for Cuyahoga and Franklin counties, which have the most traffic.
The average daily miles driven numbers for 2021 won’t be available until after the year is over. But in 2020, there were 49 percent more fatal crashes per million miles driven in southeast Ohio compared with the statewide number.
It was 48 percent more in 2019, 117 percent more in 2018, 29 percent more in 2017 and 49 percent more in 2016.
Also notable is the rate of fatal crashes went up even as the average number of daily miles driven went down during the pandemic.
This was the case not only in southeast Ohio but also statewide.
The average number of daily miles driven in southeast Ohio in 2020 was down more than 11 percent from 2019, but the number of fatal crashes per million average daily miles driven rose 23 percent.
When crashes happen, fatal or otherwise, the law enforcement report notes which variables were associated with the crash. The list includes things like driving under the influence of drugs and/or alcohol, speeding, not wearing a seat belt, running a red light or stop sign, and whether the driver was older (over age 50) or younger (age 15 to 24).
These variables are not necessarily the cause of the crash but may have contributed to it or to its severity.
Multiple variables may be associated with a single crash. For example, it may have involved a younger driver who was under the influence and sped through a red light.
One of the graphs included in this story lists the top five variables associated with fatal crashes. The graph includes all fatal crashes from 2016 through 2021 so far.
The top five fatal crash variables for southeast Ohio are not wearing a seat belt, an older driver, driving under the influence, speeding and a younger driver.
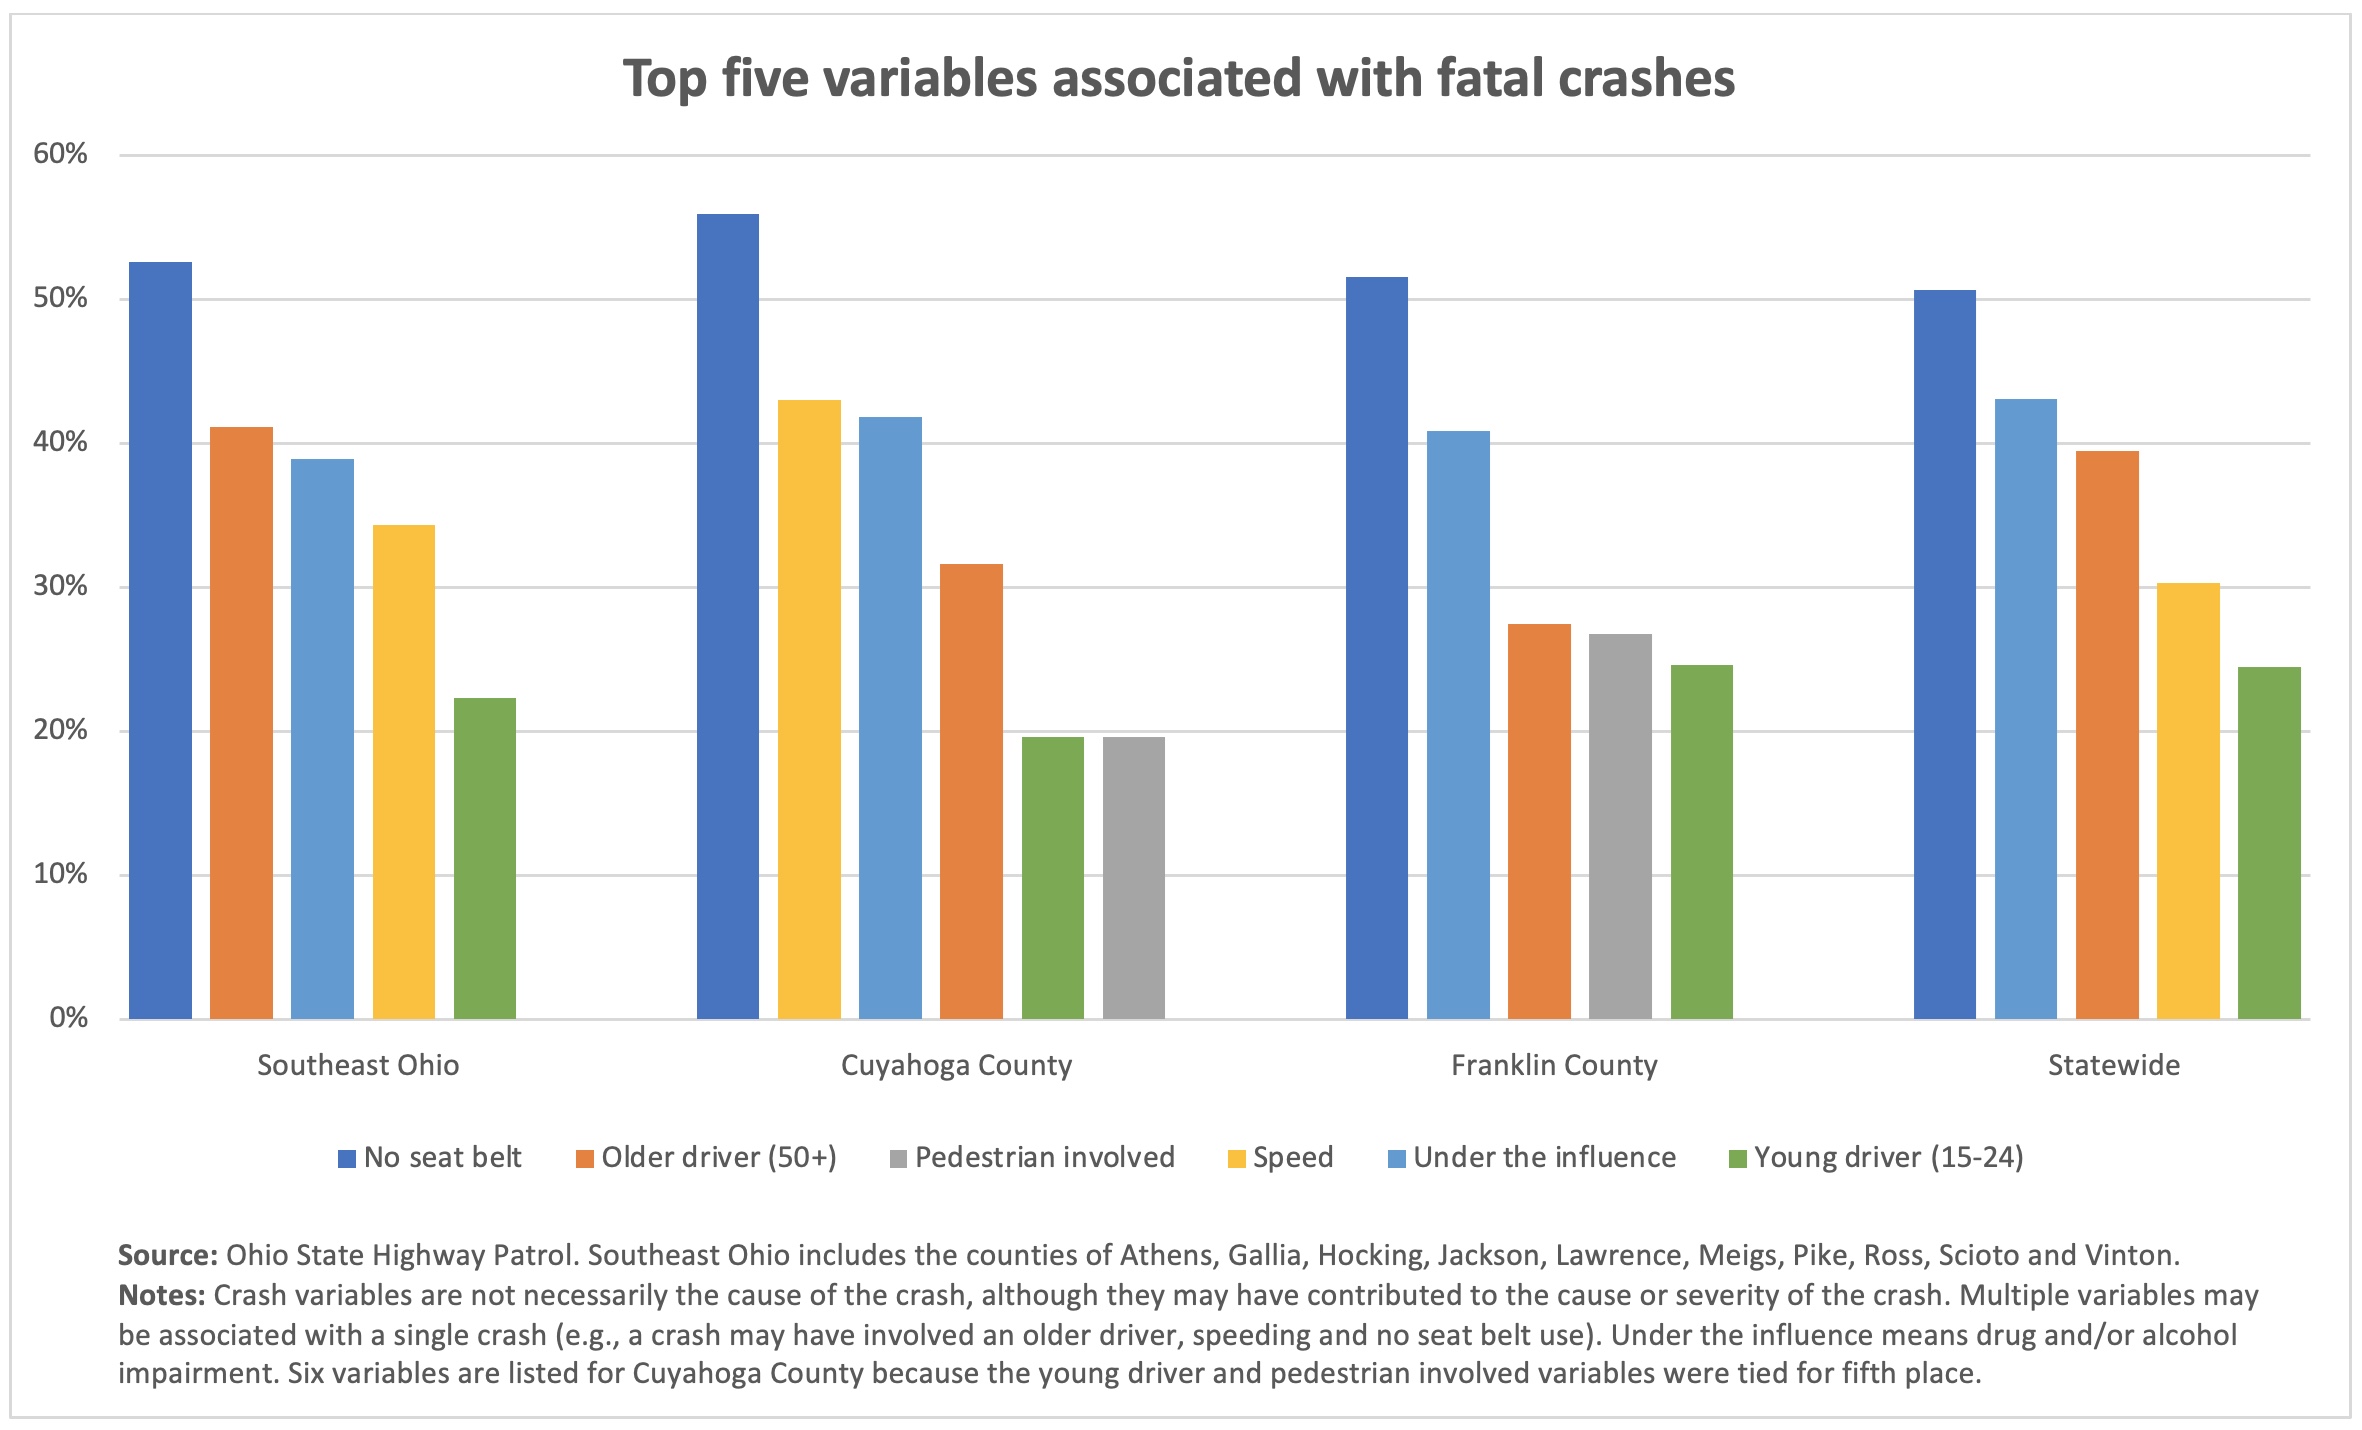
There were some differences between southeast Ohio and Cuyahoga and Franklin counties.
For example, the percentage of fatal crashes involving older drivers was much lower in those two counties. And fatal accidents involving pedestrians made the top five for those two counties but were far down on the list in southeast Ohio.
This suggests there may be more older drivers in southeast Ohio as a percentage of the driving population and that there are more people out walking in the more urban Franklin and Cuyahoga counties compared with the mostly rural southeast.
But this doesn’t necessarily mean that older drivers, or pedestrians, are the cause of the crashes and that this explains the differences in overall fatal crash rates.