News
Ohio Valley Divide: Vote Analysis Shows Bluer Cities, Deeper Red Rural Places
By: Suhail Bhat | Ohio Valley ReSource
Posted on:
LOUISVILLE, Ky. (OVR) — President-elect Joe Biden received a bigger turnout in the Ohio Valley in 2020 than Hillary Clinton did in 2016. So did his opponent Donald Trump.
In an election that saw historic levels of voting nationwide, Democrat Biden added 3.2% to Clinton’s 2016 vote share in the Ohio Valley while Republican Trump improved 2.4% on his 2016 turnout.
Biden’s increase in vote share outpacing Trump’s gains doesn’t mean that he outperformed Trump. If anything, Trump continued to do well in three states of Ohio Valley: Kentucky, Ohio and West Virginia. He bagged more than 60% of votes in Kentucky and West Virginia and had 53.3% of votes in Ohio, once a swing state.
Trump votes in Kentucky declined slightly to 62.1% compared to his voting percentages in 2016, while he saw a 1.2% rise in West Virginia and a more than 3% jump in Ohio, largely fueled by increasing margins in rural counties.
An analysis by the Ohio Valley ReSource found that the urban-rural voting divide deepened in this year’s election as coal producing and rural counties again voted in big numbers for Trump while the region’s urban centers trended for Biden. High unemployment rates fueled by pandemic shutdown seemed to have played little role in voting decisions.
Independent and new voters divided equally between the two candidates, according to the ReSource analysis.
Deeper Urban-Rural Divide
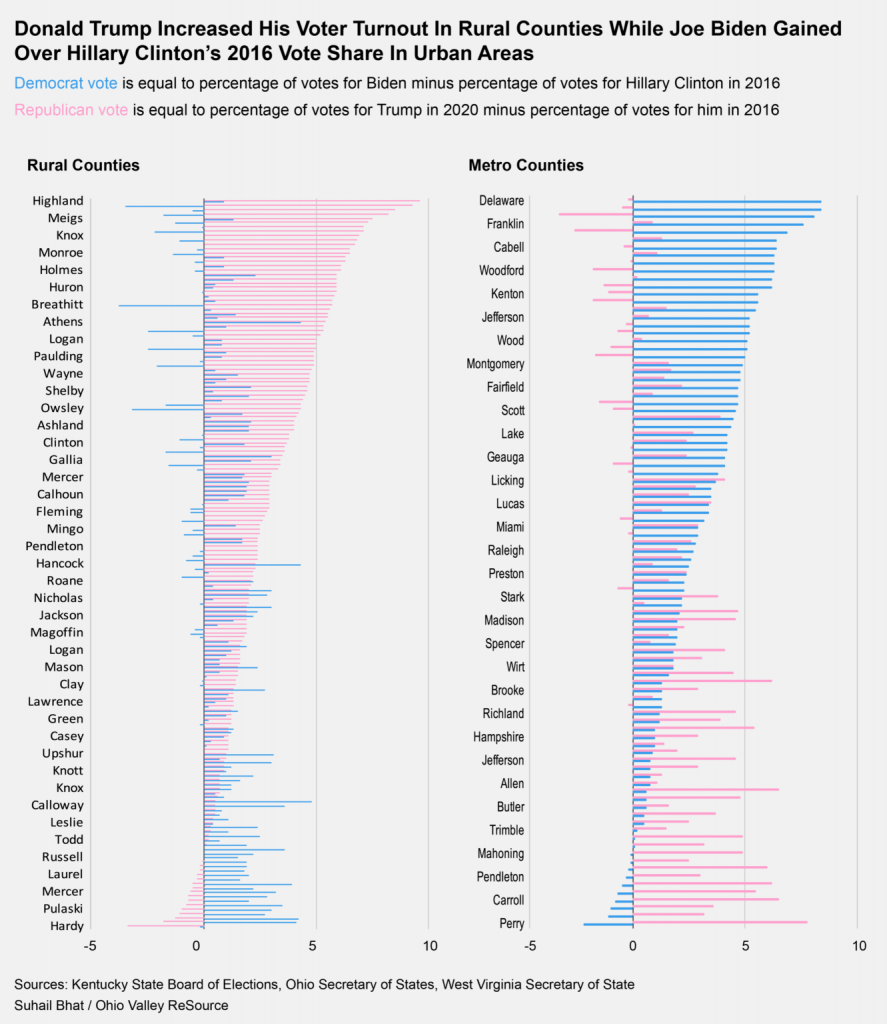
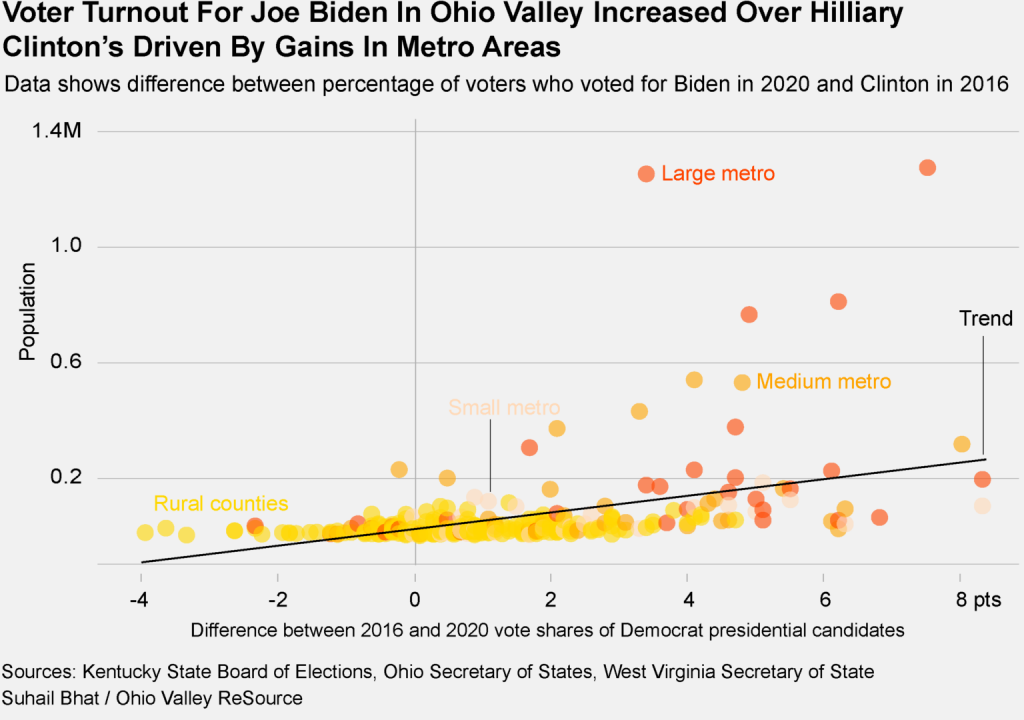
Most of Biden’s turnout gains were in the region’s metro areas. But his campaign message centered on bringing people together and making the economy work for the working class failed to appeal to the voters in the rural counties where Trump continued to build on his 2016 votes.
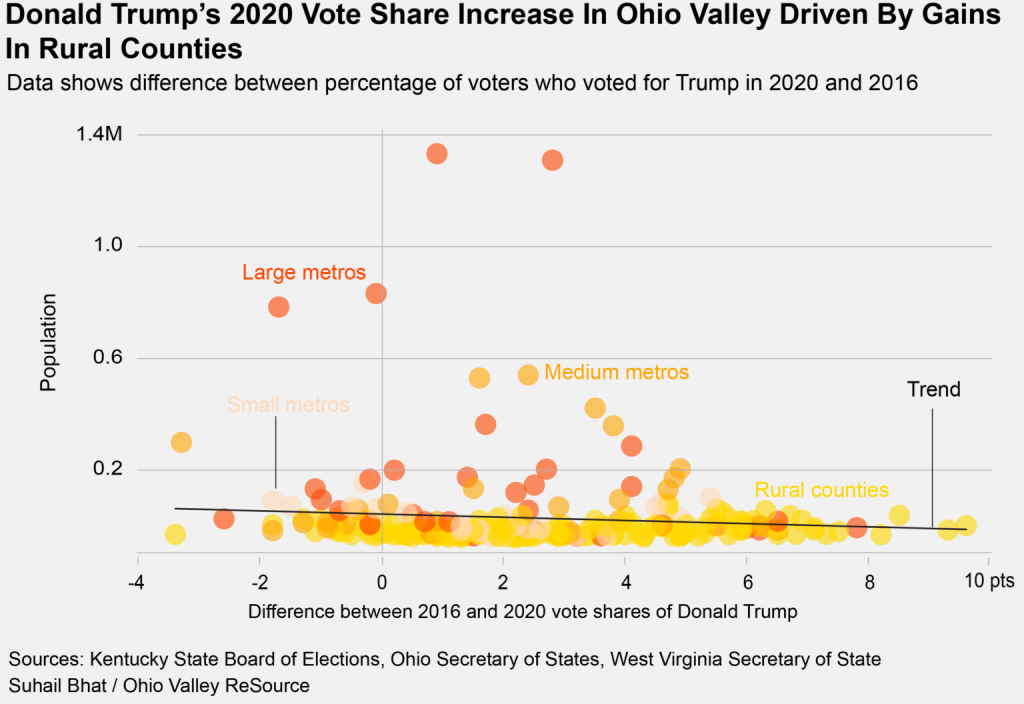
Voting numbers show a deepening divide between rural and urban areas in the Ohio Valley as voters in rural counties overwhelmingly voted for Trump while Biden’s increase in turnout was mostly driven by metro areas, the ReSource analysis shows.
Metro areas are divided into three categories: small, medium and large. Counties in metropolitan areas that have more than one million population are large metros. Medium metros are the ones with populations between 250,000 and one million while small metros are counties with fewer than 250,000 people. Any county outside metropolitan statistical areas is considered as rural. In the Ohio Valley, there are 169 rural counties, 35 large, 29 medium and 30 small metro counties.
The voting divide between rural and urban areas in the Ohio Valley works well for Republicans because more than a third of Ohio Valley residents live in rural counties where Trump beat Biden by 47.1 points. These margins start narrowing in metro areas. In small metros, Trump’s margin over Biden was 33 points and in medium metros, it was 7.2 points. On the flipside, Biden led Trump by 3.3 points in large metros.
In 2016, Trump had leads of 45 points over Clinton in rural counties, 34.3 points in small metros and 8.3 points in medium metros. But, in large metros, Clinton edged past Trump by 0.6 points.
This suggests that Biden was able to build his base in large metros where he had a 2.7 point gain over Clinton’s 2016 margin while he performed nearly the same or slightly better than Clinton in small and medium metropolitan areas.
Increasing his vote share in large metros doesn’t mean Biden was able to win more counties than Clinton. He won 9 counties, mostly in metropolitan areas. Among rural areas, only Athens County, Ohio, went to Biden.
However he succeeded in getting more votes than the 2016 Democrat nominee in 203 counties. Republican turnout also increased in 221 counties.
Biden flipped Montgomery in Ohio that Trump won by a narrow margin in 2016 by a 2.1% lead while Mahoning County in Ohio swung 5.1% to Trump.
In some of the largest counties in the region such as Franklin, Hamilton and Cuyahoga in Ohio and Jefferson and Fayette in Kentucky, Biden had a healthy lead between 15% and 35%. However, he lost West Virginia’s most populous county Kanawha to Trump by 15%.
Coal Country & Trump
Trump won about 57% of votes in the Ohio Valley in the 2020 presidential election. This 2.4% gain on his vote share in 2016 can be partly attributed to his decisive victory in counties that produce coal.
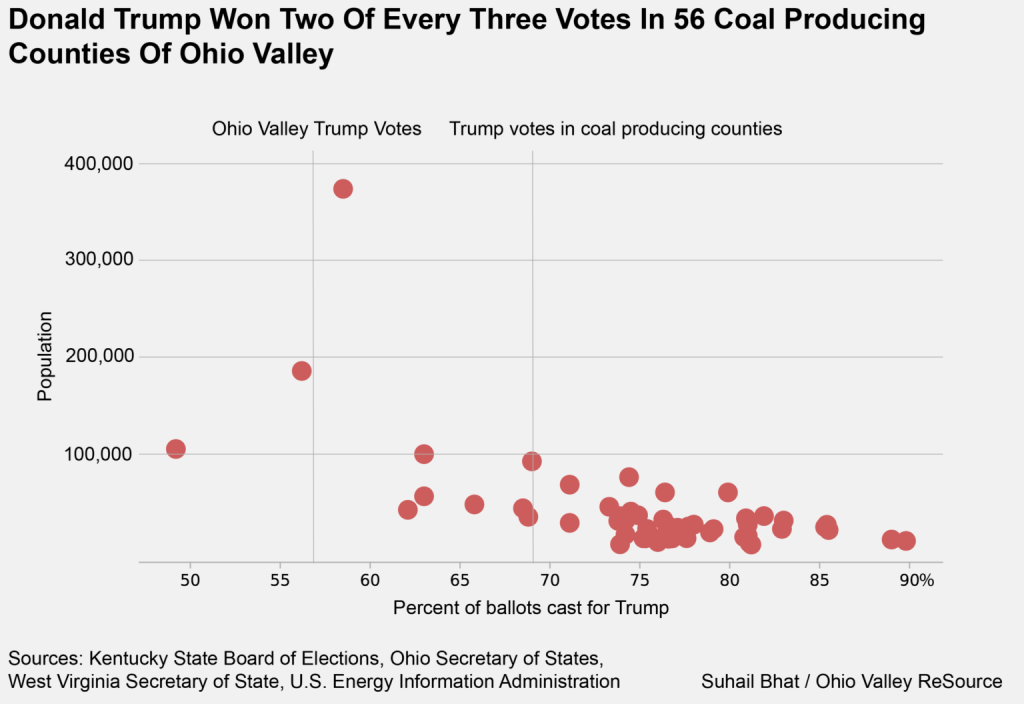
Of the 263 counties in the Ohio Valley, 56 counties are categorized as coal-producing counties, according to the federal agency U.S. Energy Information Administration. Trump scored more votes than Biden in all these counties amassing a combined 69% votes in these counties compared to Biden’s 30%.
These counties have been dented by a collapsing mining industry, high unemployment rate, severe food insecurity and poverty that gave birth to the opioid crisis. Trump appealed to these voters as they felt ignored by Washington politicians for decades. Because these voters awarded comprehensive wins to Trump, it has been labelled as ‘Trump Country.’
But as the ReSource has reported, a substantial chunk of eligible voters in these counties don’t participate in elections, with a combination of mistrust toward the political establishment and barriers to voting leading to some of the nation’s lowest rates of voter turnout. The 2020 presidential election was different because voter turnouts increased across these counties, in line with the rest of the region and country, possibly due to an expansion of mail-in and early voting options.
In most coal-producing counties, Trump got two of every three votes in both 2016 and 2020 elections. In Kentucky’s Leslie County, Trump won nearly 90% of votes. In Ohio’s Noble County, he bagged more than 80%, and in West Virginia’s Wyoming County, he got around 86% votes. Many of the coal-producing counties are some of the poorest counties not only in the region but nationwide.
Did the economy matter?
The ReSource analysis found that Trump was able to score big margins even in counties that witnessed devastating unemployment rates in April this year when the COVID-19 pandemic was spreading across the country, forcing state economies to shut down.
Ohio’s Logan and Erie Counties and Kentucky’s Magoffin and Marion Counties, for example, all saw more than 25% unemployment in April. Trump won those places with healthy margins — two of those counties with a more than 50% margin.
Overall, the ReSource analysis suggests that voters in the region appear to have ignored those unemployment numbers when they went to cast their ballots in the general election, or did not blame Trump for the economic downturn.
New & Independent Voters
In the 2016 presidential election, there were about 7.2% of voters who didn’t vote either Republican or Democrat.
This year, that number declined to 1.6%, meaning that the majority of those independent voters either didn’t vote or voted for candidates of Republican and Democrat parties.
It is hard to gauge which way these voters went. Assuming all these voters voted this time as well, that could mean 451,526 independent votes went to either of the two major parties.
Voting data from the Ohio Valley states shows that there were 507,927 new voters in this year’s election that would include first-time voters or voters who didn’t vote last election.
If independent votes are combined with new votes, the total comes to a near one million votes. Trump increased his vote count by 482,582 in this election and his rival Biden by 476,871.
This means each of these two candidates took half of those independent, new and first-time voters. This shows that both candidates appealed equally to new and independent voters.
The Ohio Valley ReSource is supported by the Corporation for Public Broadcasting and our partner stations.


